The Trend Report, July 2025 Edition
Several years ago, a Fortune 100 company with operations in Tucson adopted a dispersed work model— well before Covid made “Zoom fatigue” a common condition. Employees could work from anywhere. Literally. I had a neighbor who worked for this company but had no idea there was a site here in Tucson.
This company, a leader in tech, embraced video calls and digital collaboration. For a while, it worked. But then came the realization: team cohesion was vanishing, productivity slipped, and people missed the casual banter that sparked big ideas. So, the company brought people back to the office. The reason? Culture, collaboration, and the understanding that Slack emojis are a poor substitute for in-person interaction.
Fast forward to 2025, and the sentiment is echoing across Tucson. Businesses—encouraged by federal nudges and internal culture shifts—are coaxing employees back into the workplace. But it’s not just desks and whiteboards anymore. Today’s offices need to be engaging spaces where people want to spend time. The modern office pitch includes everything from food trucks and cold brew on tap to on-site gyms, dry cleaning services, EV charging stations, and yes—even mobile auto repair. Because who doesn’t want their oil changed while in a budget meeting?
Tucson by the Numbers
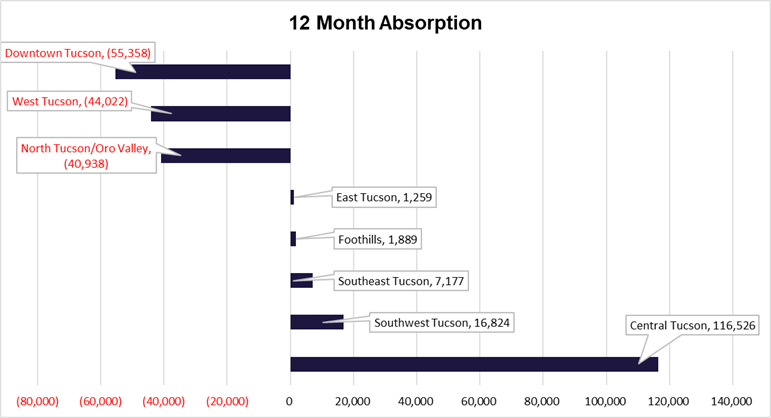
All this energy, though, hasn’t quite flipped the stats. Tucson’s office market is still in recovery mode. Q2 continues the trend of negative absorption that started in 2024, with downtown Tucson, North Tucson/Oro Valley, and West Tucson bearing the brunt.
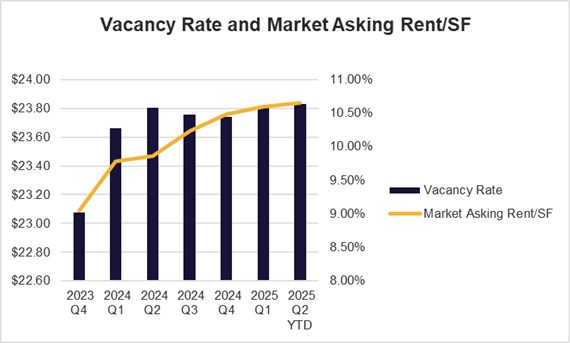
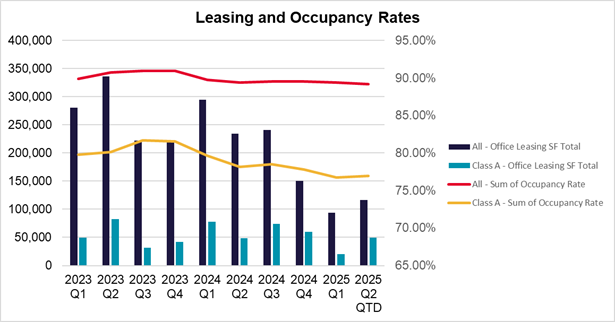
Still, there are signs of resilience. Vacancy rates remain relatively steady at 10.6%, just a hair up from 10.4% at the end of 2024. That’s not bad, considering the rollercoaster the sector has been riding. And while absorption is down, rental rates are up, averaging $23.84 per square foot a nod to rising construction costs and improved building amenities.
As for new construction? Still on pause. With high interest rates and cost uncertainty, tenants and investors alike are choosing to rehab existing space rather than build new. Tucson may not be breaking ground, but it is repurposing it—smartly and stylishly.
Sales: More Dollars, Higher Cap Rates
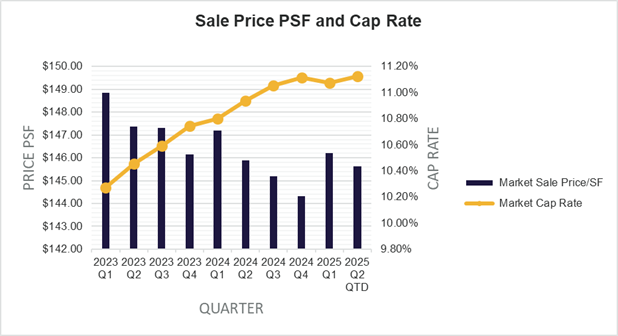
On the sales side, there’s some good news. The average sale price of office properties in Tucson is climbing, even as market cap rates trend upward from 10.8% to 11.1%. That might spook some sellers, but others see an opportunity in repositioning well-located assets.
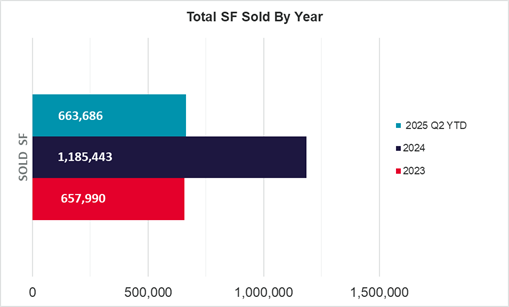
What’s especially notable is that the square footage sold year-to-date (YTD) in 2025 has already surpassed 2023—and could outpace 2024 if the pace continues. There’s investor confidence in the Tucson market, especially for well-located, updated properties.
Sublease Space: Still Hanging Around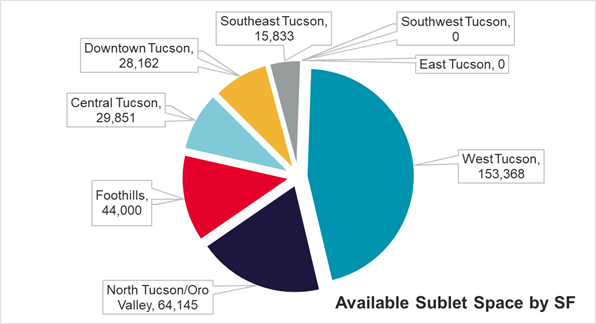
Of course, not all space is moving quickly. Sublease availability remains high, with 335,359 square feet on the market. West Tucson holds the lion’s share at 57%, followed by the Foothills at 16%. Much of this space is a legacy of remote first strategies and right-sizing, and it’s likely to linger until the market absorbs the current supply.
The Winners: Medical and Class A
Two bright spots emerged: medical and class A office space—the rock stars of Tucson’s Q1 2025 leasing scene. Four of the largest leases in the quarter were medical, driven largely by TMC’s ongoing expansion. These deals alone accounted for 66,800 square feet, or 33% of all space leased in Q1. Equally positive was class A office space, making up 34% of the quarter’s leasing activity. Companies still value premium buildouts, great locations, and amenity-rich environments. Turns out, marble lobbies and fast elevators still have their fans.
DOGE—No, Not the Meme Coin
And finally, let’s talk DOGE—not the Shiba Inu cryptocurrency, but the Disposition of Government-Occupied Excess space (we agree, the acronym could use a rebrand). Tucson has weathered the recent wave of government lease terminations fairly well. Only 12,126 square feet were terminated in Q1, about 0.04% of the total market. But whether that’s the end remains to be seen.
Wrapping It Up
Tucson’s office market in 2025 is a bit like a plant coming out of dormancy. There’s growth happening—quietly, slowly, but with intention. Businesses are back, but different with tenants, landlords, and investors alike adapting to a new era where workplace design, flexibility, and amenities matter more than ever.
So, next time you see a Tucson office with a barista and a mobile mechanic out front, don’t be surprised. It’s not just an office—it’s the new workplace ecosystem. Welcome back.

Molly Gilbert, CCIM is a Tucson-based commercial real estate professional specializing in medical and office properties. With a background in economic development and a passion for community growth, she brings strategic insight and a client-focused approach to every transaction. She can be reached at mgilbert@picor.com.
All data is from CoStar. DOGE data is from Doge.gov/savings. Assisted by AI for clarity and polish. Original draft and final approval by a real human.


