To read the full report on Tucson’s multifamily activity in Q2, click here.
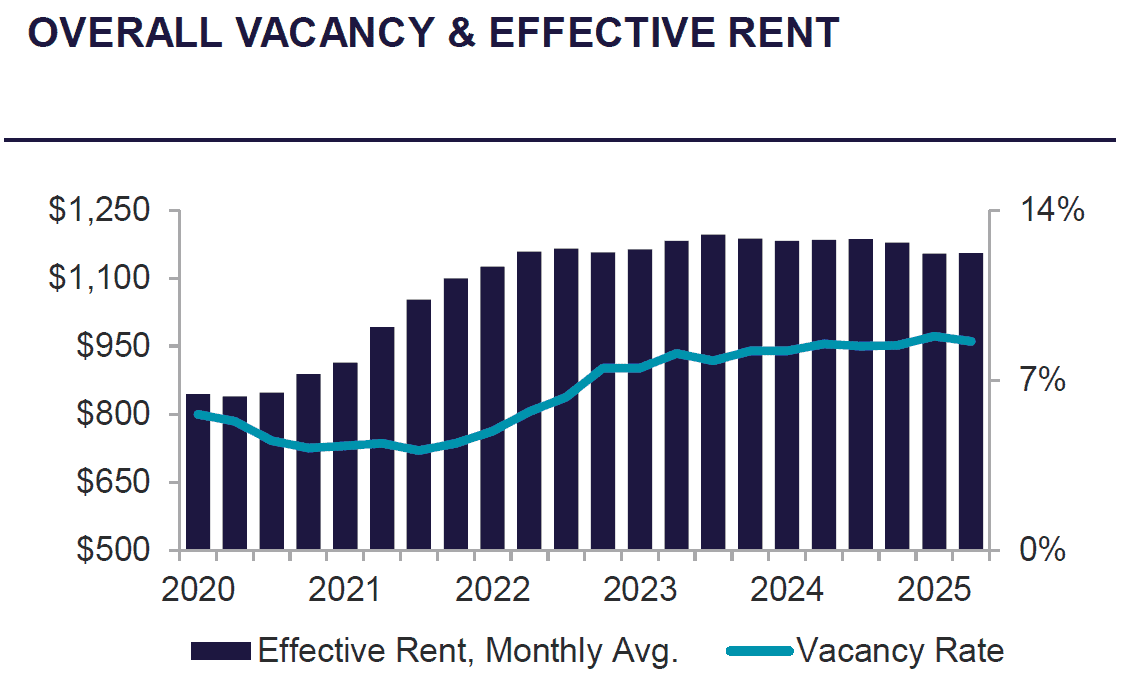
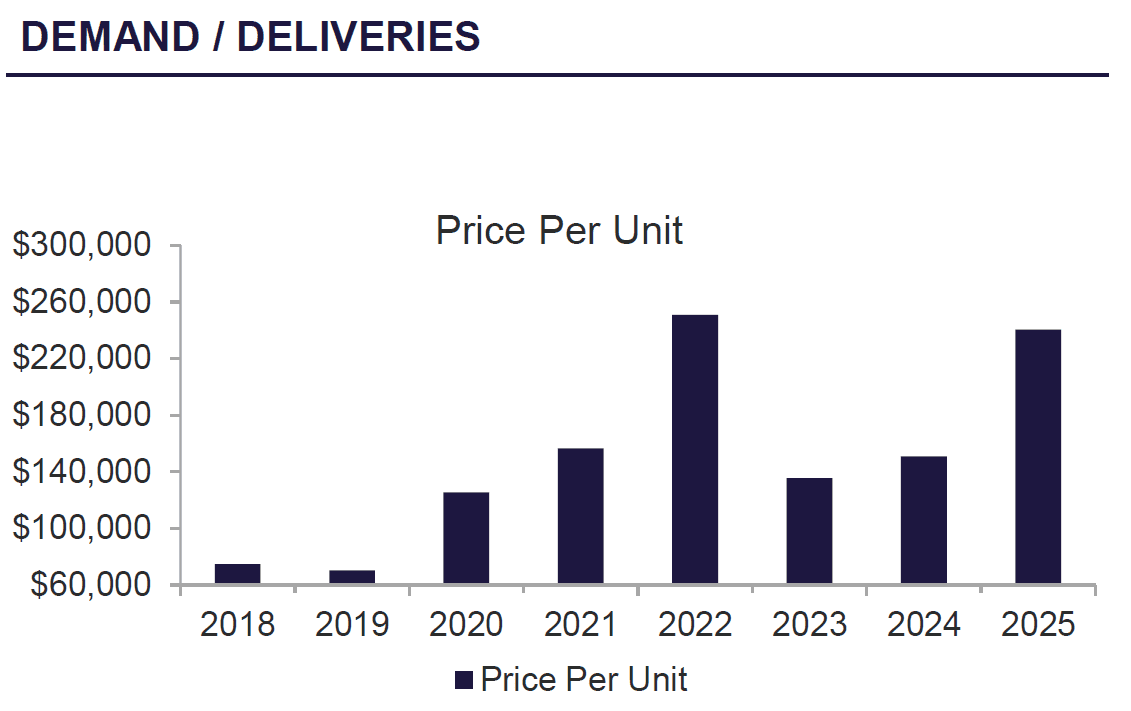
Tucson’s multifamily market remained relatively stable in Q2 2025, with the average vacancy rate decreasing slightly to 8.65% and gross rents increasing slightly to $1,156 per unit, a 0.17% quarterly gain. While rents showed slight improvement, year-over-year (YOY) performance remained soft, with average rents down -2.45% and property values reflecting buyer selectivity. In Q2, just one arms-length sale transacted over 100 units, a newly-constructed 156-unit asset which closed at $240,385 per unit and $251.38 per square foot. Sales in the 5–100 unit range demonstrated the strongest investor demand for value-add opportunities and deals with seller financing, which continued to draw multiple competing offers and premium pricing.
Q2 showed slight improvement, with average vacancy decreasing to 8.65% down from Q1 (8.81%) but still slightly above previous year. Most submarkets saw vacancy declines, with the lowest rates in Catalina Foothills (6.55%) and Northwest Tucson (6.95%), while Flowing Wells posted the highest vacancy (10.52%). Absorption totaled 383 units, led by Northwest Tucson, while the University submarket experienced the steepest drop in occupancy, most likely due to the student housing cycle. South Tucson/Airport recorded the largest annual rent growth (4.33% YOY). Concessions averaged $44 per unit, trending gradually downward from both the previous quarter and prior year.
“Purchase transactions ranged from historically stable products to value-add opportunities. Loan-to-cost has improved over the last quarter as sellers’ expectations have adjusted to current market conditions. Cap rates have widened but are holding steady, while interest rates remain volatile, tracking treasury benchmarks. Fed Fund rate cuts appear likely in the near future, though no formal announcements have been made by the Fed Chair. Currently, PFCU is pricing multifamily projects in the mid to high 6% range, depending on the origination fee and fixed-rate period. The average Loan-to-cost for Q2 was 65.72%, with a high of 73.33% and a low of 56.66%. Underwriting challenges persist, particularly with securing insurance carriers willing to provide reasonable coverage without excessive premiums. Despite these headwinds, Tucson’s multifamily fundamentals remain intact. Q2 2025 represents a snapshot in time, as the region continues to leverage the I-10 corridor and the University of Arizona to attract employers. Forecasts reflect tightening occupancy and rent stabilization.”
– Robert Motz, 520-202-0672 Pima Federal Credit Union
Tucson’s multifamily market remained slow in the second quarter of 2025, with few closed transactions but a notable surge in listings—many priced with outdated expectations from 12–18 months ago. These listings often failed to reflect current market conditions, including softening rent growth, higher insurance and maintenance costs, rising cap rates, and elevated interest rates. In this environment, precise underwriting that accounts for today’s operational realities is essential. Location remains a key driver of demand: well-located assets continue to attract strong buyer interest and competitive pricing, while lesser locations struggle to gain traction. Despite these headwinds, our team has consistently achieved success by pricing accurately and closing deals—unlike many listings left stagnant by misaligned expectations. We’ve leaned into honest pricing strategies and tailored marketing efforts to meet today’s buyer behavior. As a result, our listings have not only stood out but moved efficiently from launch to close.