To read the full report on Tucson’s office activity in Q2, click here.
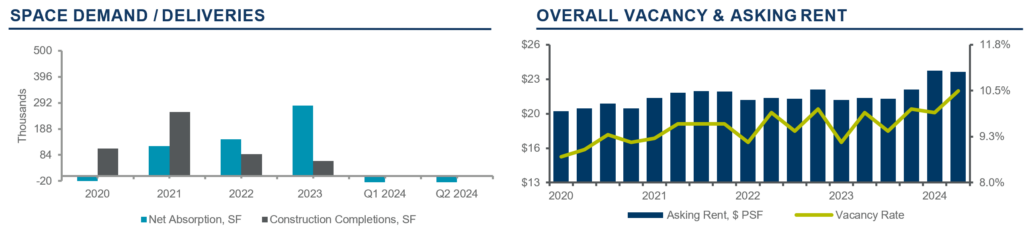
The vacancy rate in Tucson’s office market remained relatively stable, with a slight increase to 10.5% during Q2 2024. Tucson continues to outperform larger cities, remaining less affected by broader macroeconomic trends. The medical market remains a bright spot, with sustained high demand and limited supply of better-quality product. The scarcity of inventory for medical properties, coupled with rising construction costs, has driven premium prices for turnkey properties.
Medical users actively sought to expand or open new practices. Given the low availability of medical office build outs, many are willing to undertake conversions themselves post-purchase or agree to longer lease terms (seven-plus years) with landlords. A notable trend is the conversion of large office properties to industrial use, driven by high industrial demand, provided the ceiling heights meet requirements. This trend presents an opportunity for owners to shift to meet market demand in a time of high call-center vacancy.
Central Tucson, Northwest Tucson, and the Foothills submarkets continued to be hot spots in the market. There was strong demand for freestanding medical buildings and smaller offices around 2,500 square feet (sf), which often lease or sell within just a few weeks.
Notable leases included the Pain Institute of Southern Arizona, which secured 8,190 sf on the second floor at 1020 S Harrison. The second largest lease was at 1760-1790 E River, where an undisclosed tenant leased 8,018 sf. Significant sales for Q2 featured the Pioneer Building downtown, which sold for $3.8 million, or $37.63 per square feet (psf), 4825 N Sabino Canyon, which sold for $2.7 million ($107 psf), and 3773 E Broadway, which sold for $925,000 ($82.07 psf).
Landlords sought tenants willing to commit to lease terms of three or more years, especially for larger spaces, and offered significant tenant improvement allowances for the right tenants. Prices for medical properties continued to rise, with buyers willing to pay a premium. In contrast, larger office buildings, call centers, and downtown properties saw discounted prices, illustrating a dichotomy in the market between these two extremes.