To read the full report on Tucson’s industrial activity in Q1, click here.
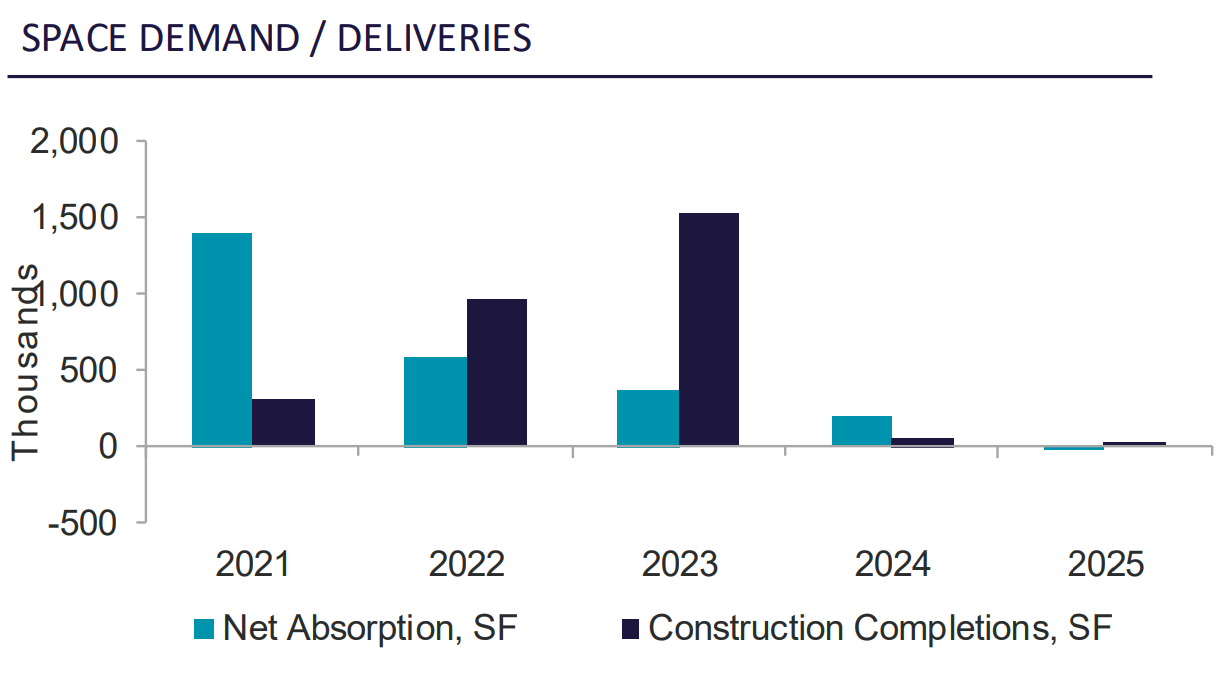
Tucson’s industrial market exhibited stability in Q1 2025, with vacancy slightly increasing to 5.7%. This rise is attributed to an uptick in sublease availability as some businesses that expanded rapidly are now contracting. Logistics, distribution, and manufacturing continue to drive demand, though smaller users are hesitant in the current political climate.
The Northwest submarket remains in high demand with little to no vacancy. The Airport area, featuring new speculative product, was another hot spot. A significant development this quarter is the groundbreaking of Drexel Commerce Center in January 2025, signaling continued confidence in the market.
Key lease transactions included Kilgore Manufacturing’s 13,952 sf lease in the Airport submarket and Western United Electrical Supply’s 12,107 sf lease in Oro Valley.
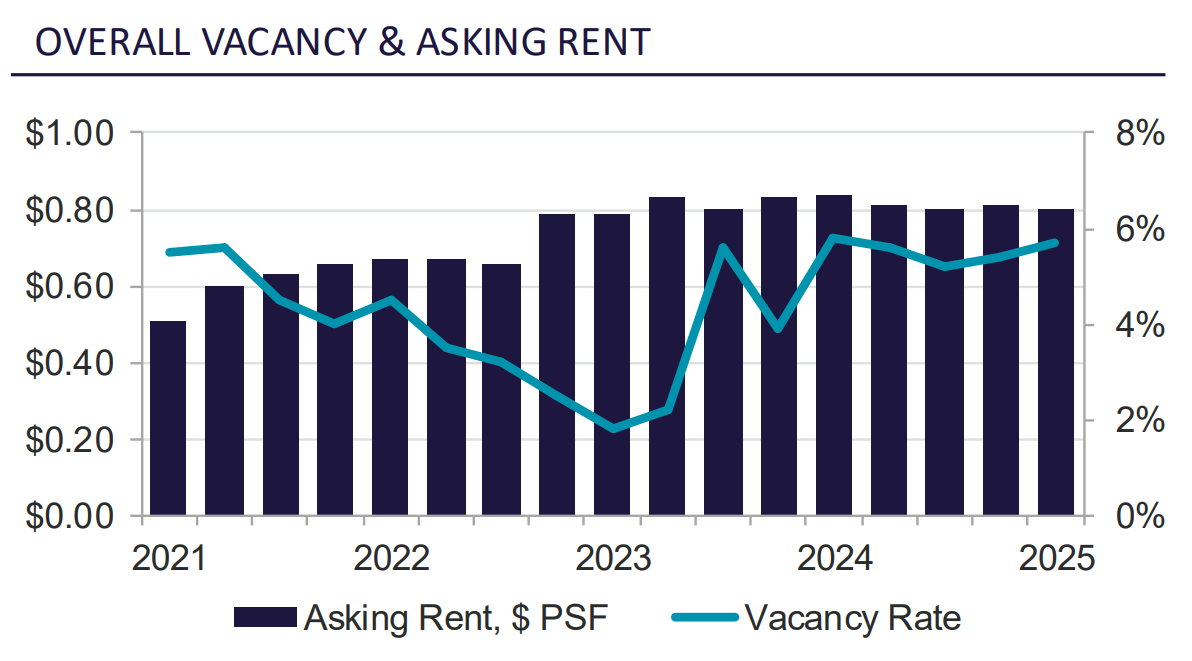
Shallow bay lease rates are rising given demand pressures and new spec developments commanding higher rates. Older properties’ rates remain stable, resulting in an average lease rate of $0.80 per sf. Construction costs have slightly decreased, leading to more active building of speculative developments.
Investment sales activity remained subdued, primarily due to high interest rates. Land purchases were moving at a slower pace, while sale pricing for existing properties remained steady. The most active submarkets for investment continued to be NW Tucson/Oro Valley, Palo Verde, and Southeast Tucson, though overall transaction volume was lower than in previous quarters. Notable sales included FJM’s acquisition of 6898-6910 N Camino Martin in NW Tucson/Oro Valley for $2.5M and JCBP LLC’s sale of 990 S Cherry Ave in Downtown to AC Pro for $2.1M. The logistics and distribution sectors are performing well, driven by e-commerce demand, though international trade and cross-border activities have moderated in the current political climate.